Sherlock CRM
How I turned a $73M marketplace's biggest operational drag into its competitive advantage
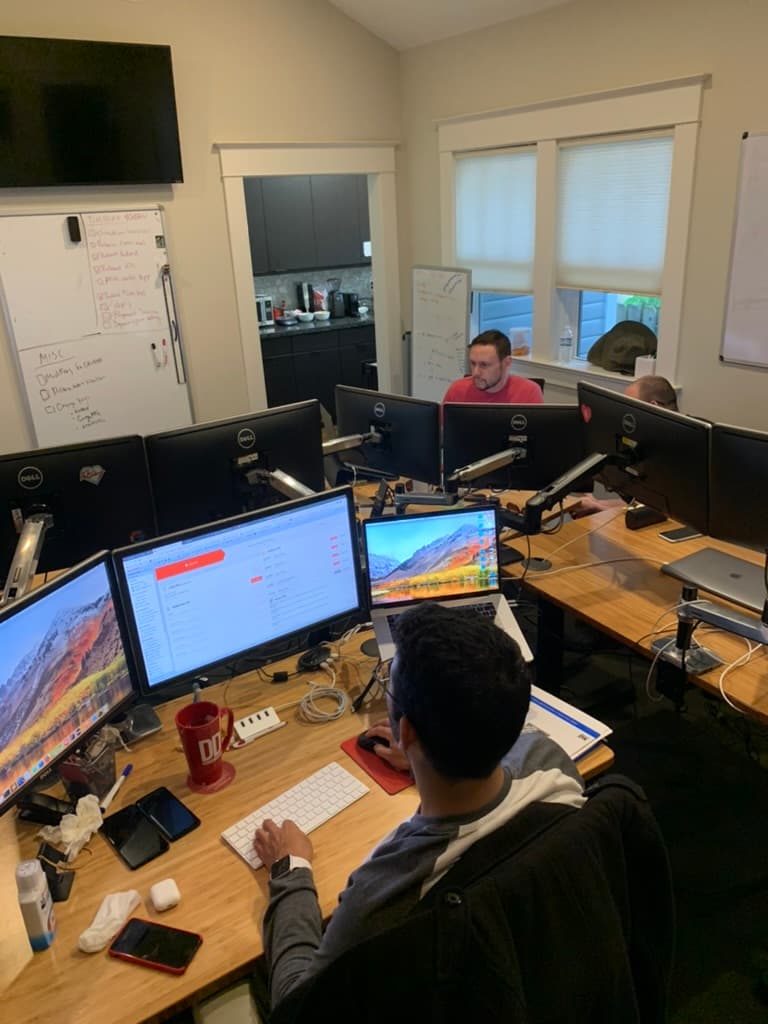
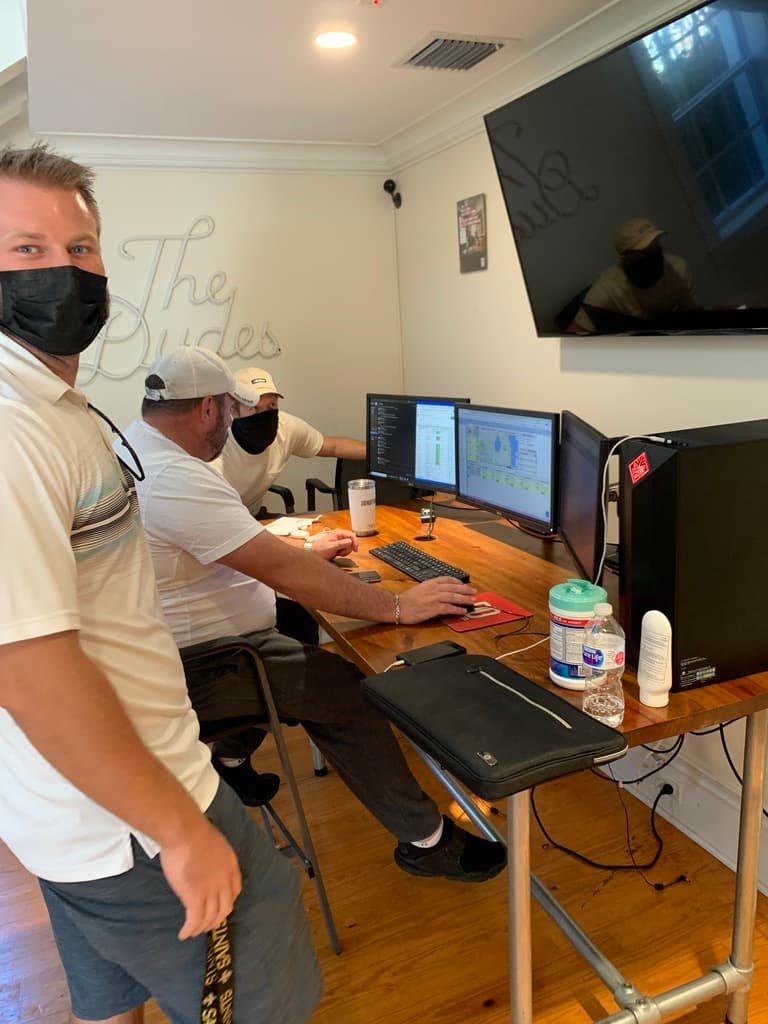
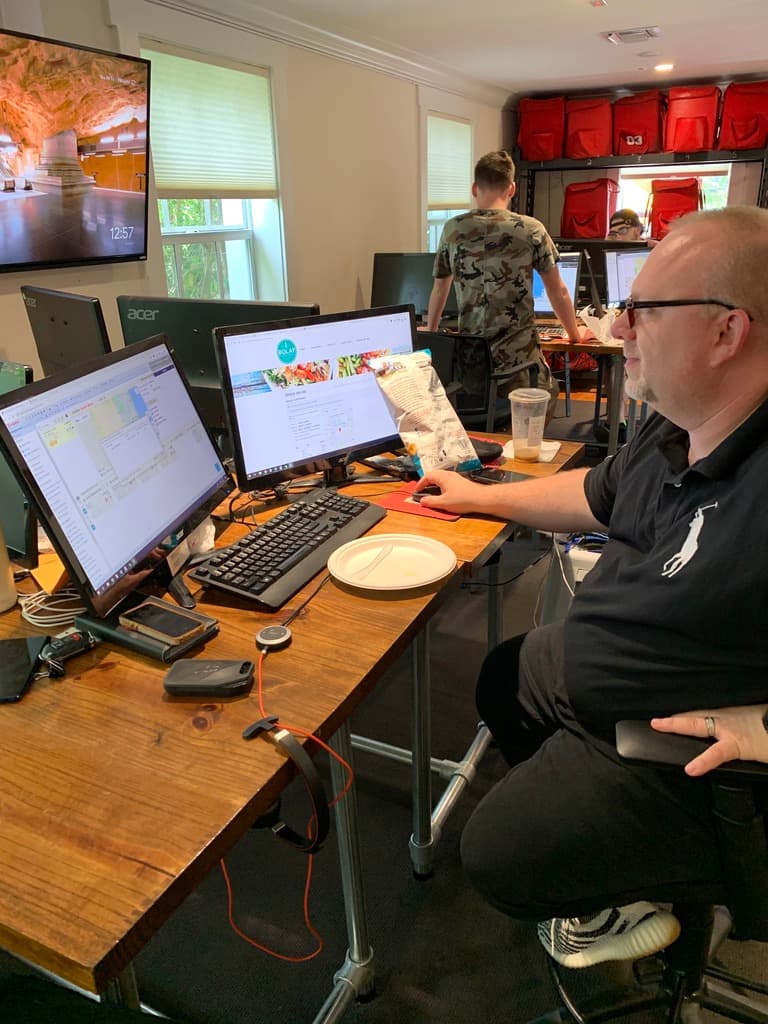
Active development: pairing with a dev, linking auto dispatch, and building in the pit.
Starting Metrics
This was the baseline scorecard that revealed the drag. Weeks 1-10 are the snapshot that made the opportunity obvious.
| Metric | Owner | Target | W1 | W2 | W3 | W4 | W5 | W6 | W7 | W8 | W9 | W10 | Trend |
|---|---|---|---|---|---|---|---|---|---|---|---|---|---|
| GMV ($) | Ops | $1.45M | $1.41M | $1.38M | $1.44M | $1.47M | $1.42M | $1.51M | $1.48M | $1.53M | $1.49M | $1.52M | Trend sparkline |
| Orders | Ops | 40,000 | 39,847 | 38,912 | 40,234 | 41,102 | 39,567 | 42,103 | 41,345 | 42,567 | 41,234 | 42,089 | Trend sparkline |
| Problem Orders | Ops | <400 | 387 | 412 | 378 | 402 | 395 | 389 | 421 | 376 | 398 | 385 | Trend sparkline |
| Refund $ | Ops | <$7K | $6,842 | $7,123 | $6,534 | $6,987 | $7,234 | $6,456 | $6,789 | $6,234 | $6,567 | $6,321 | Trend sparkline |
| Chargebacks | Ops | <75 | 67 | 72 | 58 | 71 | 69 | 63 | 74 | 61 | 68 | 65 | Trend sparkline |
| Average Ticket | Ops | $35.50 | $35.42 | $35.67 | $35.23 | $35.78 | $35.91 | $35.12 | $35.45 | $35.89 | $35.34 | $35.56 | Trend sparkline |
| Avg Order Time | Ops | 42:00 | 42:15 | 43:02 | 41:47 | 42:33 | 41:58 | 42:21 | 43:11 | 41:39 | 42:08 | 41:52 | Trend sparkline |
| Avg Restaurant Wait | Ops | <12:00 | 11:34 | 12:02 | 11:21 | 11:47 | 12:15 | 11:08 | 11:56 | 11:23 | 11:41 | 11:12 | Trend sparkline |
| Orders per Hour | Ops | >2.5 | 2.51 | 2.47 | 2.58 | 2.52 | 2.44 | 2.61 | 2.55 | 2.63 | 2.57 | 2.59 | Trend sparkline |
| Avg Discount % | Ops | 17.5% | 17.22% | 17.45% | 17.18% | 17.31% | 17.56% | 17.12% | 17.38% | 17.25% | 17.41% | 17.19% | Trend sparkline |
| Web FTUX | Product | 7.0% | 6.8% | 7.1% | 6.5% | 7.2% | 6.9% | 7.4% | 6.7% | 7.0% | 7.3% | 6.9% | Trend sparkline |
| Mobile Web FTUX | Product | 5.5% | 5.2% | 5.4% | 5.1% | 5.6% | 5.3% | 5.7% | 5.0% | 5.5% | 5.8% | 5.4% | Trend sparkline |
| iOS FTUX | Product | 8.5% | 8.3% | 8.6% | 8.1% | 8.7% | 8.4% | 8.9% | 8.2% | 8.5% | 8.8% | 8.6% | Trend sparkline |
| Android FTUX | Product | 6.5% | 6.2% | 6.4% | 6.1% | 6.6% | 6.3% | 6.8% | 6.0% | 6.5% | 6.7% | 6.4% | Trend sparkline |
| Web EUX | Product | 44% | 43.2% | 44.1% | 42.8% | 44.5% | 43.7% | 45.1% | 43.4% | 44.8% | 44.2% | 43.9% | Trend sparkline |
| iOS EUX | Product | 46% | 45.4% | 46.2% | 44.9% | 46.7% | 45.8% | 47.1% | 45.2% | 46.5% | 46.8% | 46.1% | Trend sparkline |
| Android EUX | Product | 44% | 43.5% | 44.3% | 43.1% | 44.7% | 43.9% | 45.2% | 43.2% | 44.6% | 44.1% | 43.8% | Trend sparkline |
| Web AOV (FTUX) | Product | $32 | $31.45 | $32.12 | $31.23 | $32.45 | $31.78 | $32.67 | $31.56 | $32.34 | $32.01 | $31.89 | Trend sparkline |
| Web AOV (EUX) | Product | $38 | $37.56 | $38.23 | $37.34 | $38.56 | $37.89 | $38.78 | $37.67 | $38.45 | $38.12 | $37.98 | Trend sparkline |
| iOS AOV (FTUX) | Product | $36 | $35.67 | $36.23 | $35.45 | $36.56 | $35.89 | $36.78 | $35.78 | $36.45 | $36.12 | $35.98 | Trend sparkline |
| iOS AOV (EUX) | Product | $42 | $41.56 | $42.23 | $41.34 | $42.56 | $41.89 | $42.78 | $41.67 | $42.45 | $42.12 | $41.98 | Trend sparkline |
| Android AOV (FTUX) | Product | $30 | $29.67 | $30.12 | $29.45 | $30.34 | $29.89 | $30.56 | $29.78 | $30.23 | $30.01 | $29.87 | Trend sparkline |
| Android AOV (EUX) | Product | $35 | $34.56 | $35.12 | $34.34 | $35.45 | $34.78 | $35.67 | $34.67 | $35.34 | $35.01 | $34.89 | Trend sparkline |
| D7 Web | Product | 18% | 17.5% | 18.2% | 17.1% | 18.4% | 17.8% | 18.7% | 17.3% | 18.1% | 18.5% | 17.9% | Trend sparkline |
| D7 iOS | Product | 24% | 23.4% | 24.2% | 23.1% | 24.5% | 23.8% | 24.8% | 23.5% | 24.3% | 24.6% | 24.1% | Trend sparkline |
| D7 Android | Product | 20% | 19.5% | 20.2% | 19.1% | 20.4% | 19.8% | 20.7% | 19.3% | 20.1% | 20.5% | 19.9% | Trend sparkline |
| Activation Rate - Web* | Product | 22% | 21.3% | 22.1% | 20.9% | 22.4% | 21.7% | 22.8% | 21.1% | 22.2% | 22.5% | 21.8% | Trend sparkline |
| Activation Rate - iOS* | Product | 28% | 27.2% | 28.1% | 26.8% | 28.4% | 27.6% | 28.9% | 27.0% | 28.2% | 28.6% | 27.9% | Trend sparkline |
| Activation Rate - Android* | Product | 24% | 23.3% | 24.1% | 22.9% | 24.4% | 23.7% | 24.7% | 23.1% | 24.2% | 24.5% | 23.8% | Trend sparkline |
| Phone Orders | Product | 2,500 | 2,423 | 2,512 | 2,378 | 2,534 | 2,467 | 2,589 | 2,401 | 2,523 | 2,556 | 2,478 | Trend sparkline |
| LTV | Product | $185 | $182 | $186 | $179 | $188 | $184 | $191 | $181 | $187 | $189 | $185 | Trend sparkline |
| Uptime % | Eng | 99.9% | 99.94% | 99.87% | 99.96% | 99.91% | 99.89% | 99.97% | 99.92% | 99.95% | 99.88% | 99.93% | Trend sparkline |
| Unique Visitors | Marketing | 125K | 122K | 127K | 119K | 131K | 124K | 135K | 121K | 129K | 133K | 126K | Trend sparkline |
*Activation Rate = percent of first-time users (FTUX) who place a second order within 30 days.
The Problem
Phone orders were only 25% of our volume but caused most of the operational drag. I saw it in the P&L: churn in phone operator roles, angry customers, refunds, problem orders. With 50+ offices across 5 states, every inefficiency compounded fast.
We had customer data, but the UX was a nightmare. Disparate systems, nothing surfaced at the moment of need. When a call came in, operators were jumping across tabs instead of focusing on the customer.
Competing against DoorDash and Uber Eats without their budgets meant service quality was our only edge.
"Service quality was our only edge."
What I Ruled Out
I evaluated Salesforce. $30K setup, multi-month implementation with consultants, and it still only solved half the problem - data hygiene. It would not fix the operator experience.
I killed it fast. We needed something built for our workflow, integrated with our phone system (RingCentral), and shipping in weeks, not quarters.
"Ship in weeks, not quarters."
The Solution
We built Sherlock - a custom CRM that pulled up the customer record before the operator even answered the phone. RingCentral integration meant we knew who was calling.
- -Order history and preferences
- -Notes from previous calls
- -VIP flags (including from our restaurant partners)
- -Birthday and surprise-and-delight triggers
We called it "making every customer feel like a regular." Chick-fil-A was our reference point - personalization sells.
"Making every customer feel like a regular."
Shake Shack - ShackBurger, no pickles, cheese fries, black & white shake
- Jan 5 - Shake Shack - $24.50
- Dec 29 - Houston's - $67.80
- Dec 22 - Shake Shack - $31.20
Key Decisions
| Decision | Why |
|---|---|
| Build vs. buy | Salesforce could not solve the operator UX problem. We needed tight integration with RingCentral and our ecommerce flow. |
| Chick-fil-A as the model | Personalization sells. If every call felt like they knew you, we would win on service. |
| Gamification layer | Phone ops was high churn. Added bonuses for consecutive days, order volume targets, and birthday credits for MVP customers. |
| Ship in 6 weeks, polish in the next 6 | First cycle: working product in hands. Second cycle: edge cases and iteration. |
The Connected System
Sherlock was not just a phone ops tool. It became the connective tissue across our three-sided marketplace (consumers, restaurants, drivers).
We also embedded the consumer shopping experience directly into Sherlock. Any improvements to the customer flow could be conditionally shown to phone operators, and operator insights fed right back into the customer experience. Order history and call notes powered a recommendation engine used by both sides.
We tied it into merchant records. If a caller was a VIP from one of our restaurant partners - Houston's, Modern Restaurant Group - the operator saw that flag. The manager on duty could fire an extra dessert and go above and beyond.
If a law office was spending $18K per month on catering, that data informed everything downstream:
- -Dispatch algorithm weighting
- -Which restaurants showed up first on their homepage
- -How we prioritized their orders
Single source of truth flowing through phone ops, dispatch, merchant dashboards, and the consumer app.
Impact
Second-order effects: happier operators led to better service and higher retention. Lower refunds meant a cleaner P&L. Faster orders created more capacity per shift.
Cross-functional trust mattered too. Building for ops made ops trust product. I became much closer with our Head of Ops and Franchisee lead, which opened doors for the next set of initiatives.
What I Would Do Differently
I would cut the Salesforce evaluation faster. I knew early it was not right, but I let the process run to build consensus. That was a week I could have gotten back.
I would have instrumented better analytics from day one. We measured outcomes but had to retroactively piece together behavioral data. More time up front meant cleaner attribution.
Takeaways
- 01Start with the P&L. The biggest problems show up in the numbers before anyone complains.
- 02UX problems hide in plain sight. We had the data - it just was not usable.
- 03Build vs. buy is about fit, not capability. Salesforce could do more, but it could not do this.
- 04Gamification works for retention. Operators said the streaks made it feel like a game, not a grind.
- 05Ship to learn. We did not wait for perfect data hygiene - we shipped and iterated.
Want to talk about this project?
Email me at me@parkerrex.com or connect on LinkedIn.